Network support: When traceroute isn't useful
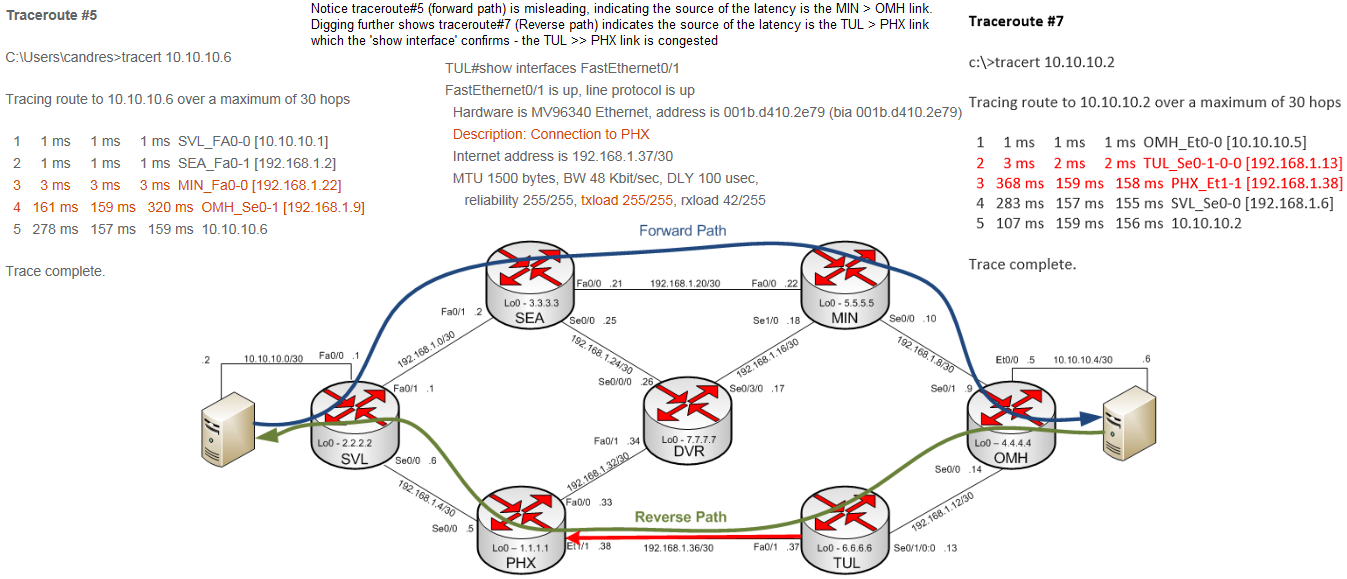
Notice Traceroute #5 and how similar it looks Traceroute #4. The latency increase again shows up between MIN and OMH. It’s easy to come to the conclusion that because the latency increases between MIN and OMH that’s where the problem must be. Let’s keep digging to see where the problem is. This is showing an example of asymmetric routing. Traceroute #7 is from 10.10.10.6 back to 10.10.10.2 and also shows an asymmetric path. Traceroute #7 shows the latency increase between TUL and PHX.
Based on Traceroute #5 (Forward Path) and Traceroute #7 (Reverse Path), we can’t say for sure where the latency is. Traceroute #5 shows the latency between MIN and OMH, Traceroute #7 shows the latency between TUL and PHX. Looking at the connection between TUL and PHX, we can see it’s the source of the latency as its congested. The congestion is depicted in the diagram below with the solid red arrow. Notice how traceroute #5 was misleading; it showed the latency is between MIN and OMH, but this wasn’t the case as the congested link is TUL to PHX. This behavior is explained in subsequent sections.
TUL#show interfaces FastEthernet0/1
FastEthernet0/1 is up, line protocol is up
Hardware is MV96340 Ethernet, address is 001b.d410.2e79 (bia 001b.d410.2e79)
Description: Connection to PHX
Internet address is 192.168.1.37/30
MTU 1500 bytes, BW 48 Kbit/sec, DLY 100 usec,
reliability 255/255, txload 255/255, rxload 42/255
Traceroutes #5 and #7


