SD‑WAN with Versa Networks support: Analytics
SD‑WAN branches, hubs, and controllers generate various logs and events for providing topology view, availability reports, traffic visibility reports, and SLA metrics.
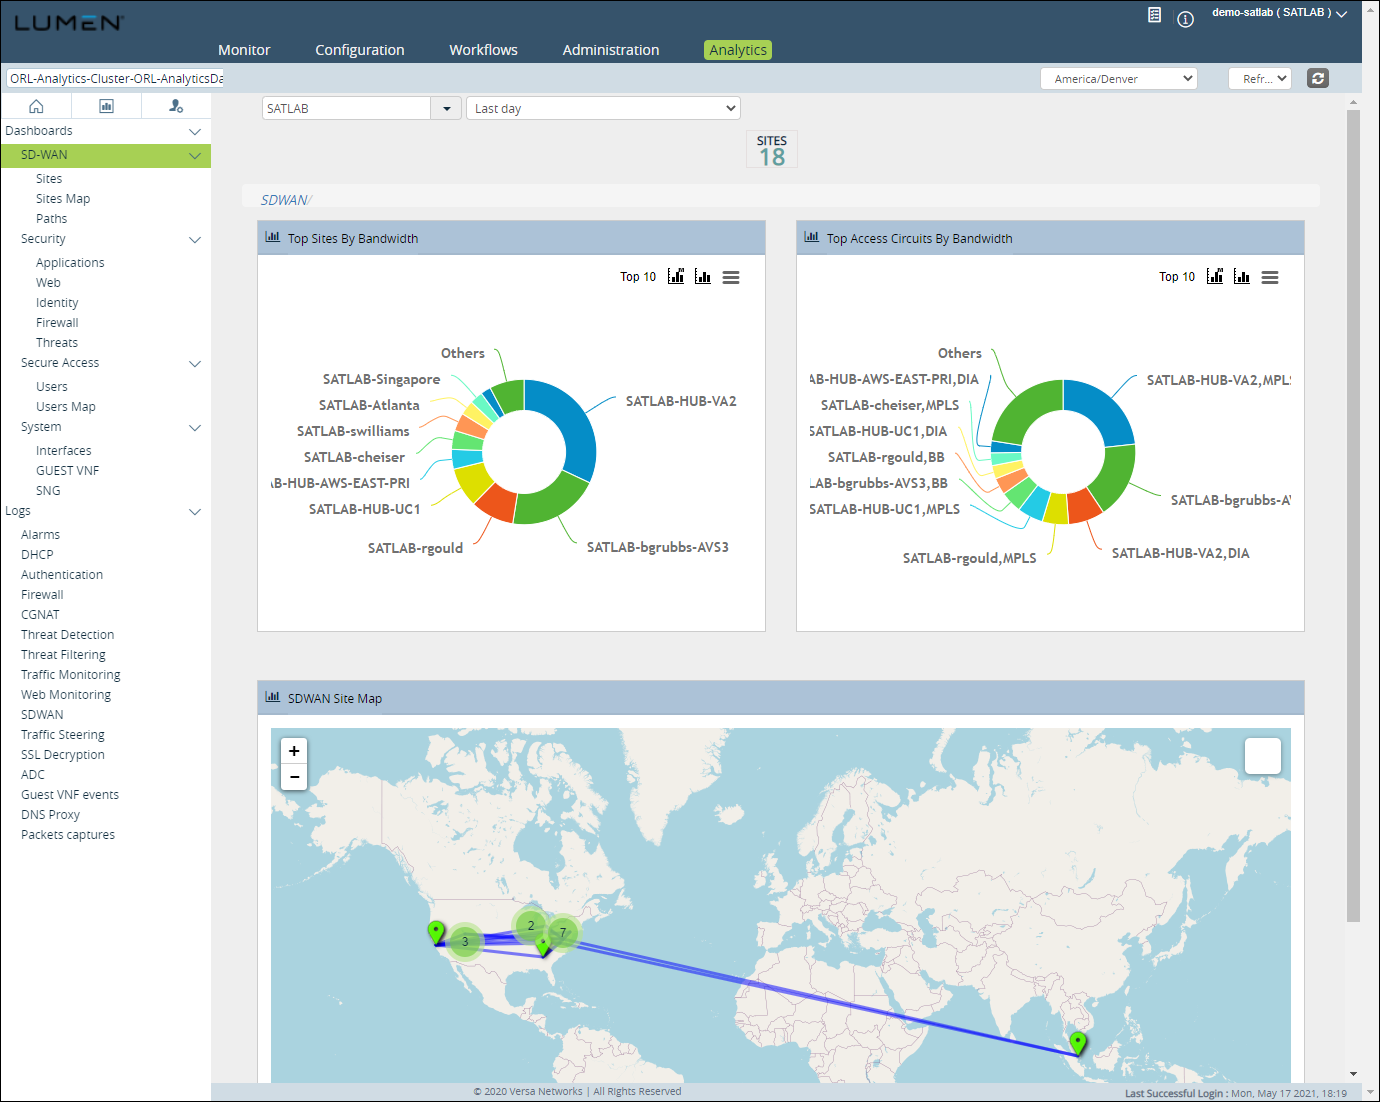
Select the Director context in Versa Director and then select the Analytics tab > Home > SD‑WAN to view the SD‑ WAN analytics dashboard. The dashboard provides you with a tenant‑level view across all the sites:
- top sites by bandwidth
- top access circuits by bandwidth
- SD‑WAN site map
The screenshot shows the SD‑WAN dashboard showing top sites by bandwidth, top access circuits, and the SD‑WAN site map.
Dashboards
Reporting


